Financial Engineering

Operating Costs: The Real Price of Ownership.

The sticker price is only 60% of the total financial commitment. Understanding fuel dynamics, scheduled maintenance, and insurance volatility is essential for long-term solvency.

Fuel Efficiency Statistics

Data from regional consumption patterns indicates that fuel costs fluctuate by up to 22% annually based on seasonal additives and global Brent crude pricing. For a standard internal combustion engine, idling and urban congestion increase consumption by nearly 15% compared to highway cruising.
$2,400

Annual Fuel Average

Based on 20,000 km per year at 8.5L/100km efficiency.

12.4%

Efficiency Loss

Average reduction in range during winter operation in northern climates.

35%

EV Savings

Projected energy cost reduction when compared to premium gasoline variants.

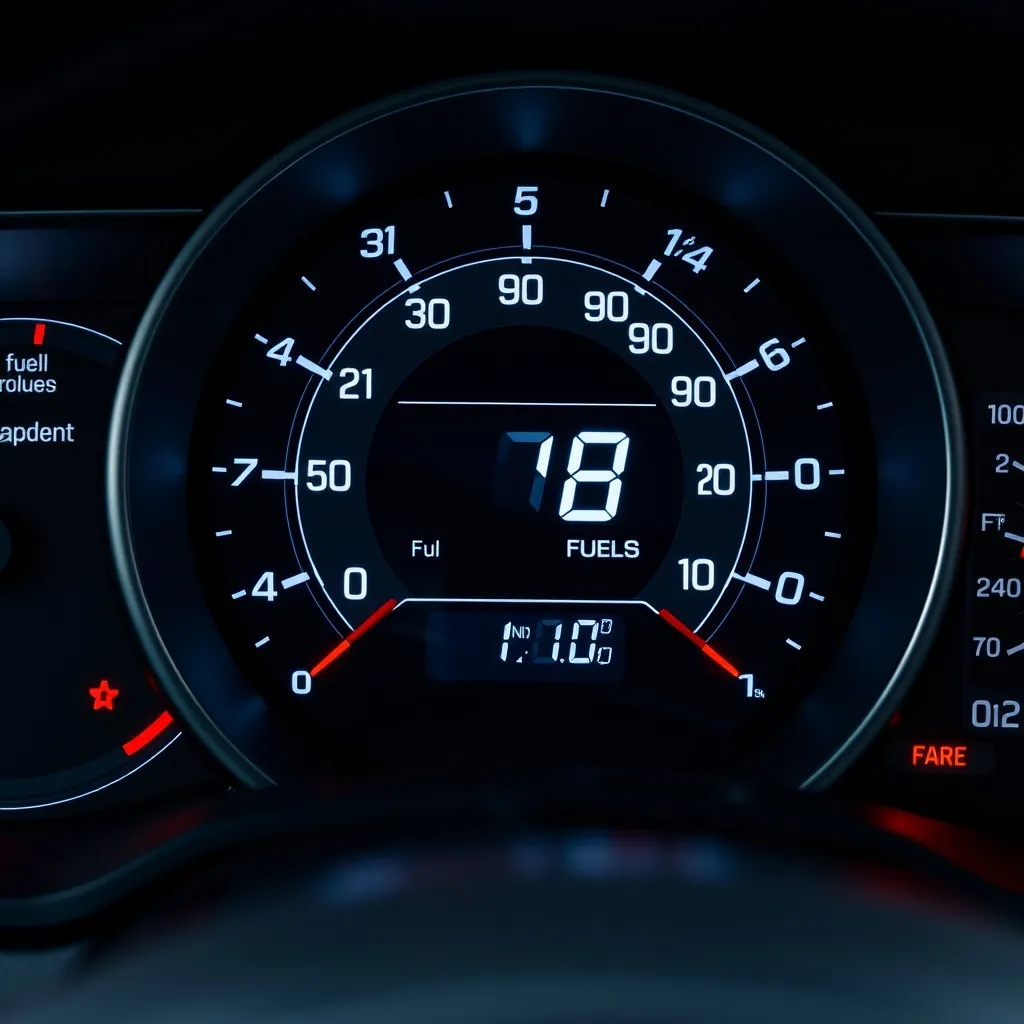
A technical close-up of a modern digital fuel gauge and cons

Maintenance Scheduling Protocol

Preventative maintenance is not a suggestion; it is a financial safeguard. Deferring a $150 oil change can lead to engine sludge and thermal degradation, potentially resulting in a $5,000 powertrain failure. We categorize maintenance into three distinct tiers: routine, mid-cycle, and major overhaul.

Routine service includes fluid analysis, filter replacements, and tire rotations every 8,000 kilometers. Mid-cycle service, typically at 50,000 kilometers, involves brake pad replacement, cooling system flushes, and spark plug inspection. Major intervals occur at 100,000 kilometers, requiring timing belt checks and transmission fluid replacement.

Critical Maintenance Checklist

  • Tire Pressure Monitoring: Improper inflation increases rolling resistance and reduces tire life by 20%.
  • glyph-ui Braking Systems: Worn pads accelerate rotor warp, doubling repair costs if ignored.
  • Cabin and Engine Filters: Clogged filters reduce HVAC efficiency and increase fuel consumption.

For those considering a transition to electric vehicles, the EV Financial Impact section details how the absence of traditional internal combustion components significantly alters these maintenance schedules.

Insurance Premium Factors

Insurance is the most volatile variable in the operating cost equation. Premiums are dictated by actuarial data involving vehicle theft rates, repair complexity, and driver history.

Vehicle Safety Rating

Modern ADAS (Advanced Driver Assistance Systems) can lower liability premiums but may increase collision premiums due to expensive sensor replacement costs.

Market Data →

Deductible Strategy

Increasing your deductible from $500 to $1,000 can reduce annual premiums by 15-30%, provided you maintain a liquid emergency fund for repairs.

Negotiation Tips →

Regional Variance

Postal codes significantly impact rates. High-density urban areas with elevated theft statistics carry a 40% premium over rural zones.

Ottawa Guide →

Usage Profiling

Telematics programs track braking, acceleration, and mileage. Low-mileage drivers can save up to 25% through data-driven discounts.

Data Policy →

Optimize Your Budget Today.

Every dollar saved on operating costs is a dollar added to your vehicle's resale value and your personal net worth. Start calculating your specific metrics now.

Access Cost Calculator